Plotly in R Programming Language allows to create interactive web graphics from ‘ggplot2’ graphs and a custom interface to the JavaScript library ‘plotly.js’ inspired by the grammar of graphics.
Installation
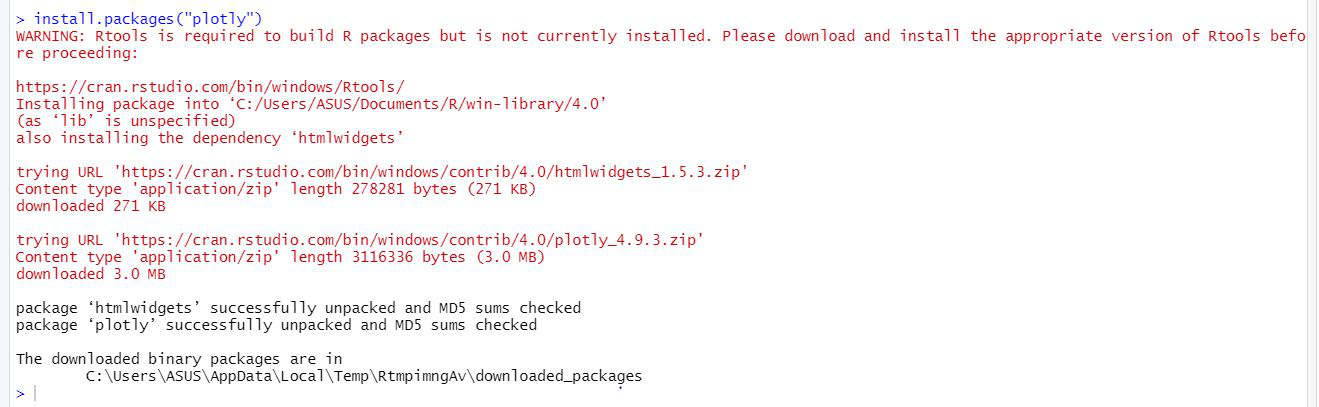
To use a package in R programming one must have to install the package first. This task can be done using the command install.packages(“packagename”). To install the whole plotly package type this:
install.packages(“plotly”)
Or install the latest development version (on GitHub) via devtools:
devtools::install_github(“ropensci/plotly”)
Important Functions
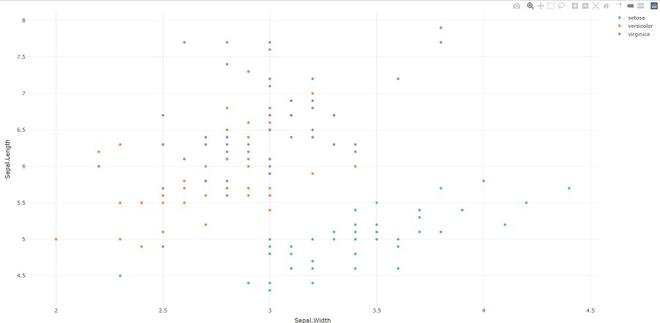
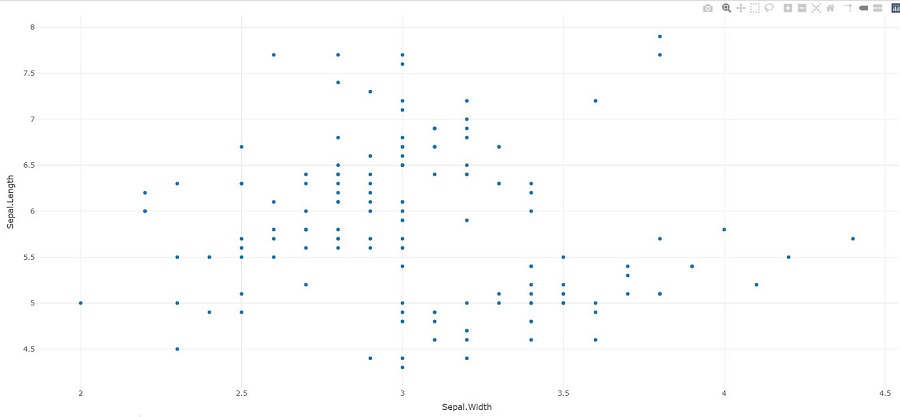
- plot_ly: It basically initiates a plotly visualization. This function maps R objects to plotly.js, an (MIT licensed) web-based interactive charting library. It provides abstractions for doing common things and sets some different defaults to make the interface feel more ‘R-like’ (i.e., closer to plot() and ggplot2::qplot()).
Syntax:
plot_ly(data = data.frame(), …, type = NULL, name, color, colors = NULL, alpha = NULL, stroke, strokes = NULL, alpha_stroke = 1, size, sizes = c(10, 00), span, spans = c(1, 20), symbol, symbols = NULL, linetype, linetypes = NULL, split, frame, width = NULL, height = NULL, source = “A”)
Example:
R
library(plotly)
p <- plot_ly(iris, x = ~Sepal.Width,
y = ~Sepal.Length)
add_markers(p, color = ~Petal.Length,
size = ~Petal.Length)
add_markers(p, color = ~Species)
|
Output:
- plotly_build: This generic function creates the list object sent to plotly.js for rendering. Using this function can be useful for overriding defaults or for debugging rendering errors.
Syntax: plotly_build(p, registerFrames = TRUE)
Example:
R
library(plotly)
p <- plot_ly(iris, x = ~Sepal.Width,
y = ~Sepal.Length)
str(plotly_bulid(p, registerFrames = TRUE))
|
Output:
No scatter mode specified:
Setting the mode to markers
Read more about this attribute -> https://plotly.com/r/reference/#scatter-mode
List of 8
$ x :List of 10
..$ visdat :List of 1
.. ..$ 29f4345ac49:function ()
..$ cur_data : chr “29f4345ac49”
..$ attrs :List of 1
.. ..$ 29f4345ac49:List of 5
.. .. ..$ x :Class ‘formula’ language ~Sepal.Width
.. .. .. .. ..- attr(*, “.Environment”)=<environment: R_GlobalEnv>
.. .. ..$ y :Class ‘formula’ language ~Sepal.Length
.. .. .. .. ..- attr(*, “.Environment”)=<environment: R_GlobalEnv>
.. .. ..$ alpha_stroke: num 1
.. .. ..$ sizes : num [1:2] 10 100
.. .. ..$ spans : num [1:2] 1 20
……..
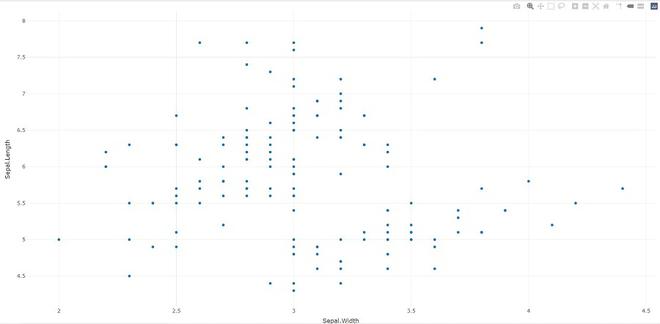
- layout: Modify the layout of a plotly visualization
Syntax: layout(p, …, data = NULL)
Example:
R
library(plotly)
p <- plot_ly(iris, x = ~Sepal.Width,
y = ~Sepal.Length)
layout(p, data = NULL)
|
Output:
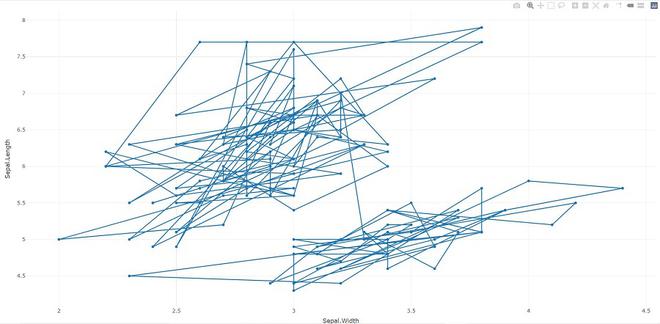
- add_trace: Add trace(s) to a plotly visualization.
Syntax: add_trace(p, …, data = NULL, inherit = TRUE)
Example:
R
library(plotly)
p <- plot_ly(iris, x = ~Sepal.Width,
y = ~Sepal.Length)
add_trace(p, type = "scatter",
mode = "markers+lines")
|
Output:
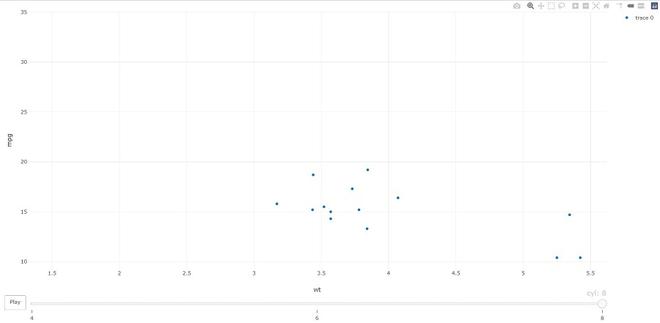
- animation_opts: Provides animation configuration options. Animations can be created by either using the frame argument in plot_ly() or frame ggplot2 aesthetic in ggplotly(). By default, animations populate a play button and slider component for controlling the state of the animation (to pause an animation, click on a relevant location on the slider bar). Both the play button and slider component transition between frames according to rules specified by animation_opts().
Syntax:
animation_opts(p, frame = 500, transition = frame, easing = “linear”, redraw = TRUE, mode = “immediate”)
animation_slider(p, hide = FALSE, …)
animation_button(p, …, label)
Example:
R
library(plotly)
plot_ly(mtcars, x = ~wt, y = ~mpg,
frame = ~cyl) %>%
animation_opts(transition = 0)
|
Output:
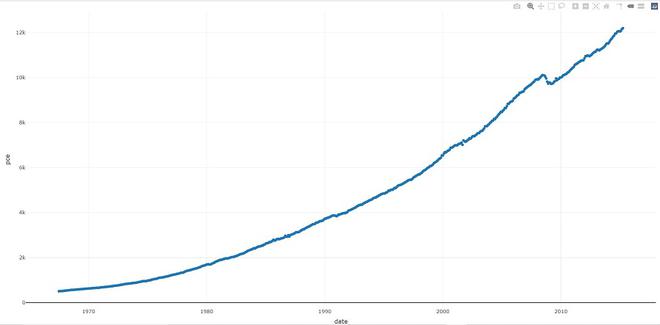
- add_data: Add data to a plotly visualization.
Syntax: add_data(p, data = NULL)
Example:
R
library(plotly)
plot_ly() %>% add_data(economics) %>%
add_trace(x = ~date, y = ~pce)
|
Output:
- plotly_IMAGE: Creates a static image for plotly visualization. The images endpoint turns a plot (which may be given in multiple forms) into an image of the desired format.
Syntax:
plotly_IMAGE(x, width = 1000, height = 500, format = “png”, scale = 1, out_file, …)
Example:
R
library(plotly)
p <- plot_ly(iris, x = ~Sepal.Width,
y = ~Sepal.Length)
Png <- plotly_IMAGE(p,
out_file = "plotly-test-image.png")
Jpeg <- plotly_IMAGE(p, format = "jpeg",
out_file = "plotly-test-image.jpeg")
Svg <- plotly_IMAGE(p, format = "svg",
out_file = "plotly-test-image.svg")
Pdf <- plotly_IMAGE(p, format = "pdf",
out_file = "plotly-test-image.pdf")
|
Output:
- plotly_empty: Creates a complete empty plotly graph. It is a very useful function when used with subplot().
Syntax: plotly_empty(…)
Example:
R
library(plotly)
plotly_example(iris)
|
Output:

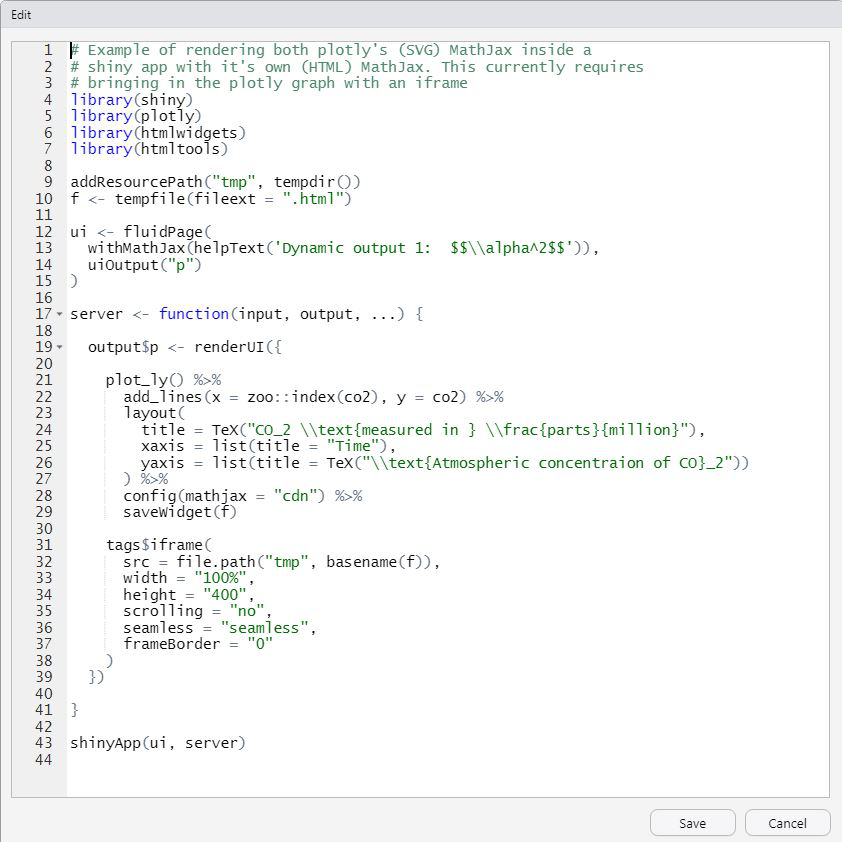
- plotly_example: It runs a plotly example(s). Provides a unified interface for running demos, shiny apps, and Rmd documents which are bundled with the package.
Syntax: plotly_example(type = c(“demo”, “shiny”, “rmd”), name, edit = TRUE, …)
Example:
R
library(plotly)
plotly_example(type = c("demo", "shiny", "rmd"),
name, edit = TRUE, ...)
|
Output:
We can leverage the plotly R package to create a variety of interactive graphics. Two main ways of creating a plotly object: either by transforming a ggplot2 object (via ggplotly()) into a plotly object or by directly initializing a plotly object with plot_ly()/plot_geo()/plot_mapbox(). Both approaches have somewhat complementary strengths and weaknesses, so it can pay off to learn both approaches.
Whether you're preparing for your first job interview or aiming to upskill in this ever-evolving tech landscape,
GeeksforGeeks Courses are your key to success. We provide top-quality content at affordable prices, all geared towards accelerating your growth in a time-bound manner. Join the millions we've already empowered, and we're here to do the same for you. Don't miss out -
check it out now!